A LOOK AT THE CONSOLIDATORS
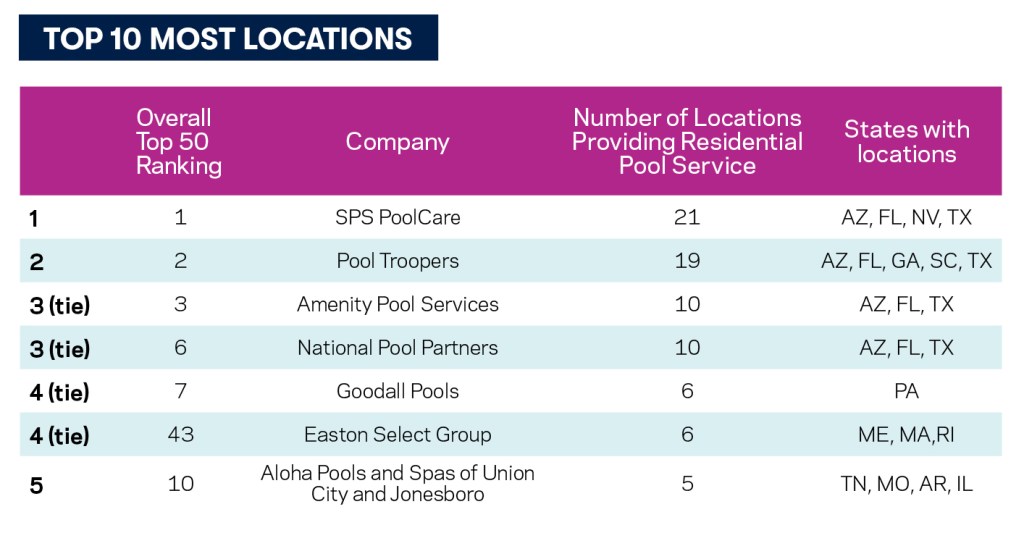
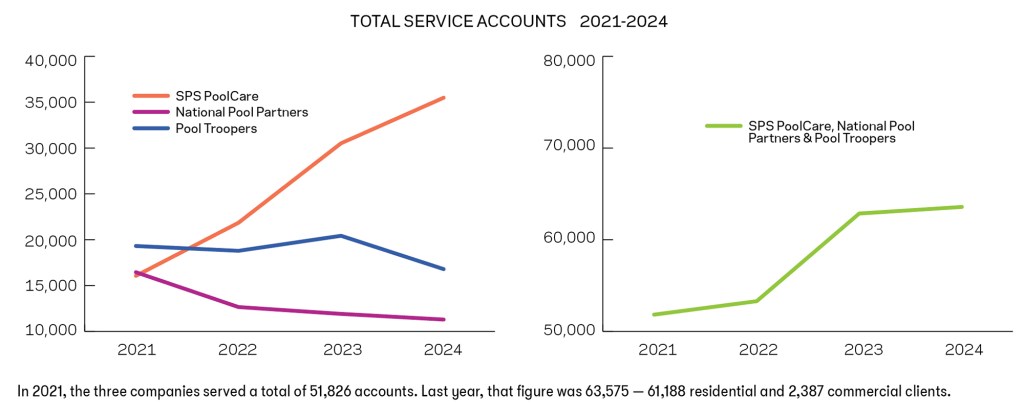
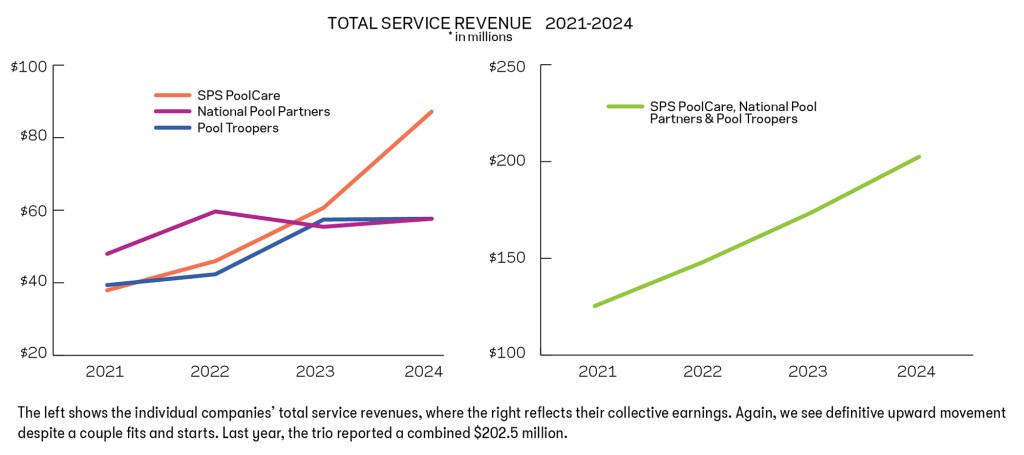
If this decade becomes known for anything in industry history, it will be for the potentially transformative power of consolidation, especially in the pool/spa maintenance sector. The movement started at the beginning of the decade, and it has made itself known in the Top 50 Service list, with several now ranking. So far, three have made the list long enough to track — SPS PoolCare (formerly Smart Pool Services, with 21 locations), Pool Troopers (19 locations), and National Pool Partners (10 locations), which all have made the list for the last four years in a row. These charts provide data points to explore how the three performed from 2021 to 2024. Growth may not have been as aggressive as expected, given the tempering effect of some economic realities. But these figures suggest that, as a combined force, these consolidators continue to gain.

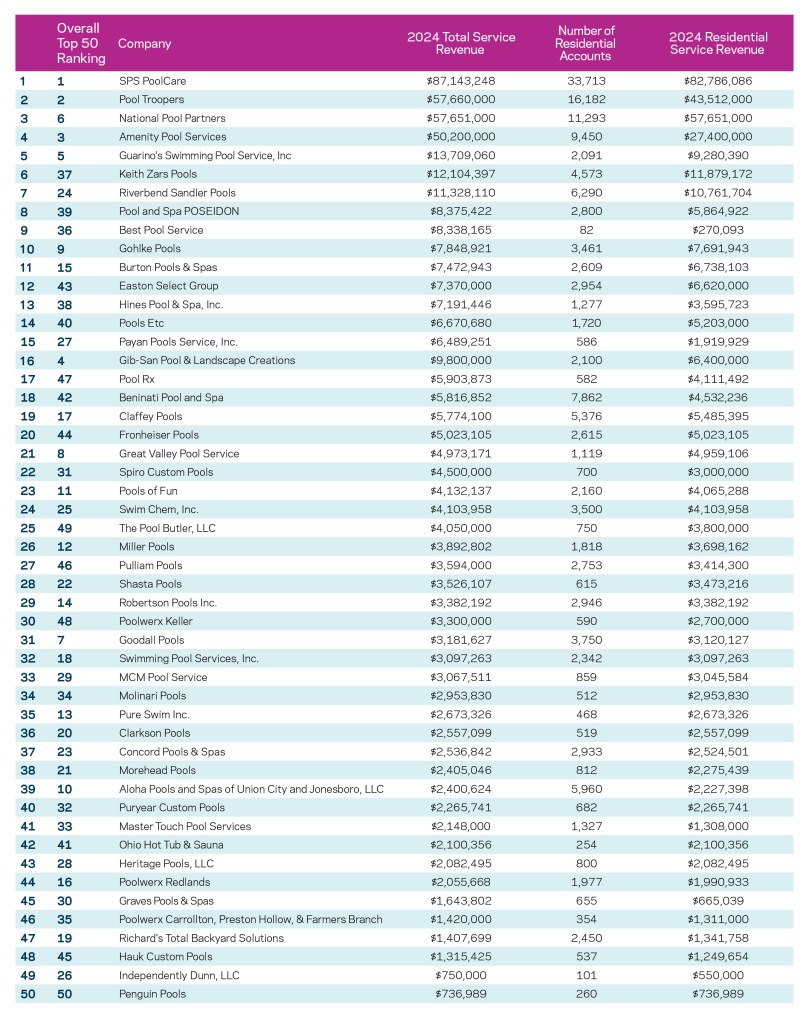
REVENUE RANKING
The chart below ranks all 50 companies based strictly on 2024 Total Service Revenue
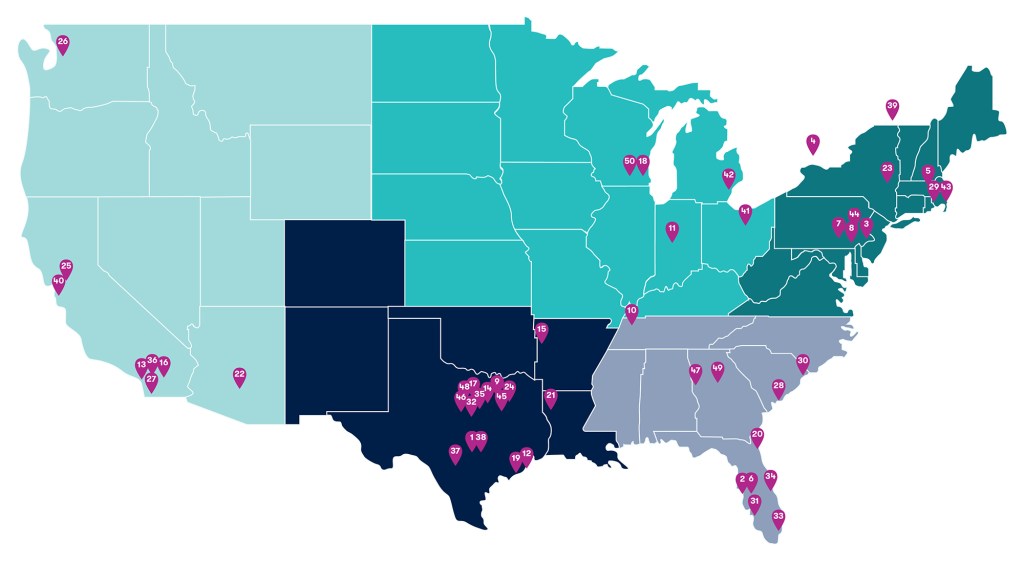
REGIONAL BREAKDOWN:
The map below shows how this year’s Top 50 Service companies are distributed throughout the U.S. and Canada. Each numbered tab represents one firm, placed in its headquarter city. The numbers indicate company ranking. Texas once again stands out, holding 14 of the slots, or 28%.
Northeast/Mid-Atlantic
Total Service Companies: 10
Locations Providing Residential Pool Service: 30
Permanent Full-Time Service Technicians: 506
Average Tenure: 6.93 years
2023 Reported Total Service
Revenue: $104,536,738
Commercial Service
Revenue: $30,599,003
Residential Accounts: 30,671
Commercial Accounts: 3,946
Residential Service Revenue: $73,937,735
Southeast
Total Service Companies: 11
Locations Providing Residential Pool Service: 43
Permanent Full-Time Service Technicians: 1,081
Average Tenure: 3.4 years
2023 Reported Total Service
Revenue: $143,550,723
Commercial Service
Revenue: $19,682,370
Residential Accounts: 39,280
Commercial Accounts: 1,421
Residential Service Revenue: $123,868,353
Southwest
Total Service Companies: 16
Locations Providing Residential Pool Service: 48
Permanent Full-Time Service Technicians: 1,040
Average Tenure: 3.6 years
2023 Reported Total Service
Revenue: $161,846,070
Commercial Service
Revenue: $11,269,698
Residential Accounts: 70,241
Commercial Accounts: 3,562
Residential Service Revenue: $150,576,372
West
Total Service Companies: 8
Locations Providing Residential Pool Service: 13
Permanent Full-Time Service Technicians: 204
Average Tenure: 7.17 years
2023 Reported Total Service
Revenue: $34,607,155
Commercial Service
Revenue: $14,422,700
Residential Accounts: 9,049
Commercial Accounts: 727
Residential Service Revenue: $20,184,455
Midwest
Total Service Companies: 5
Locations Providing Residential Pool Service: 6
Permanent Full-Time Service Technicians: 70
Average Tenure: 7.8 years
2023 Reported Total Service
Revenue: $15,883,597
Commercial Service
Revenue: $1,351,465
Residential Accounts: 12,878
Commercial Accounts: 168
Residential Service Revenue: $14,532,132
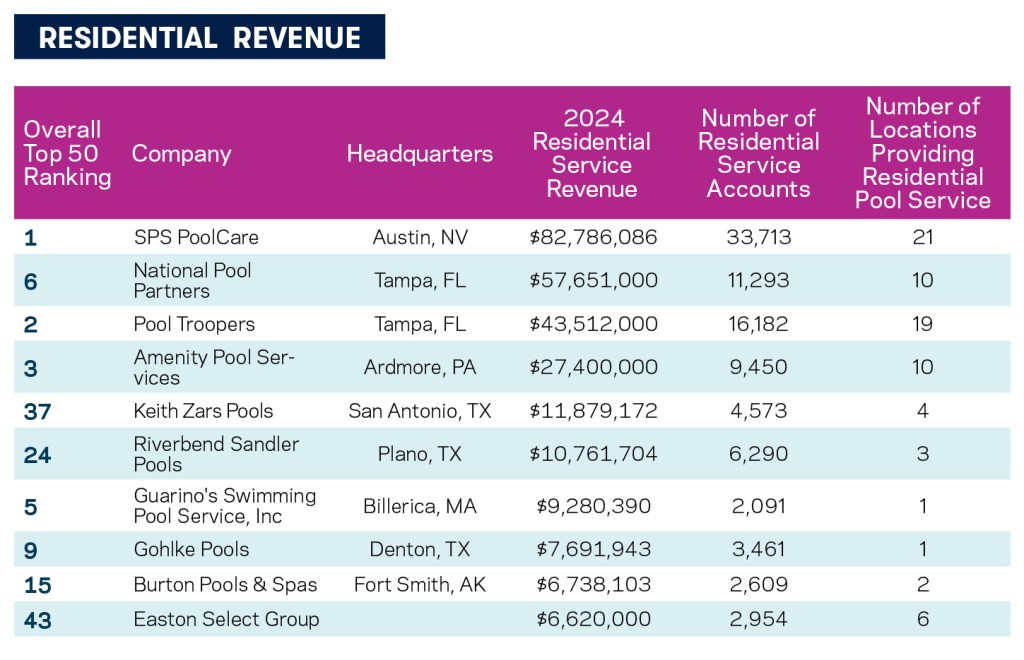
TOP 10 IN RESIDENTIAL REVENUE
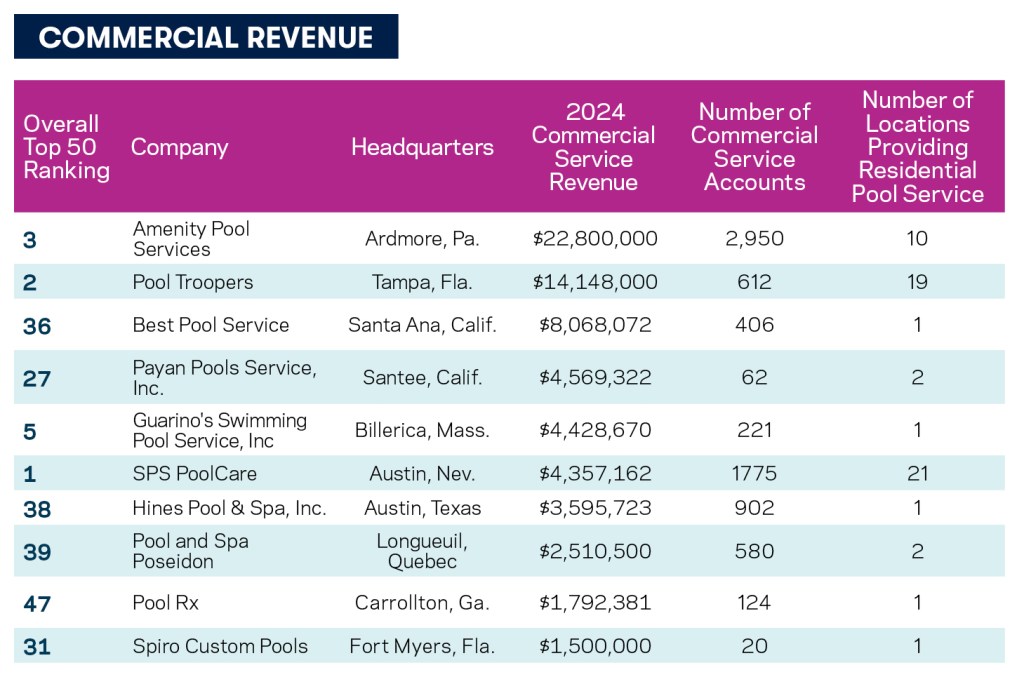
TOP 10 IN COMMERCIAL REVENUE